University Designs
Featured Designs From Various University Projects
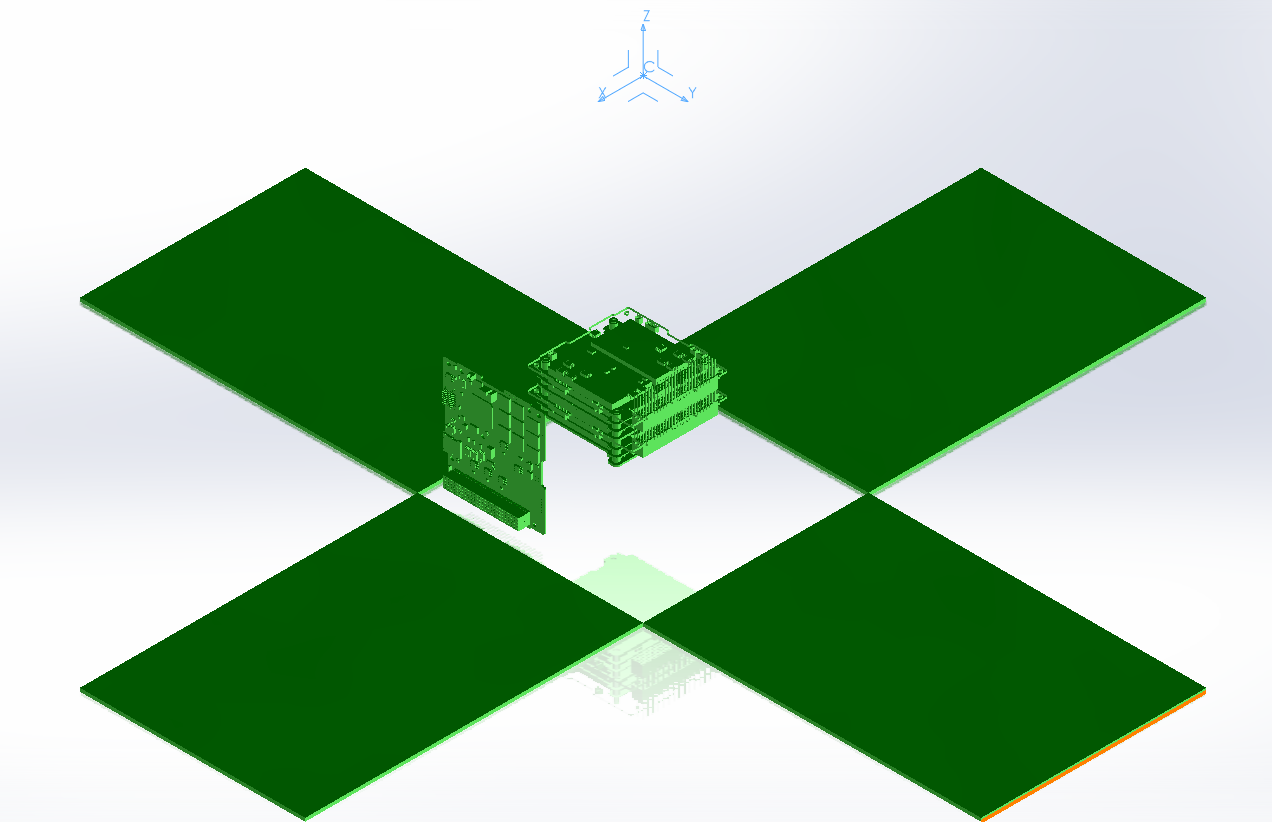
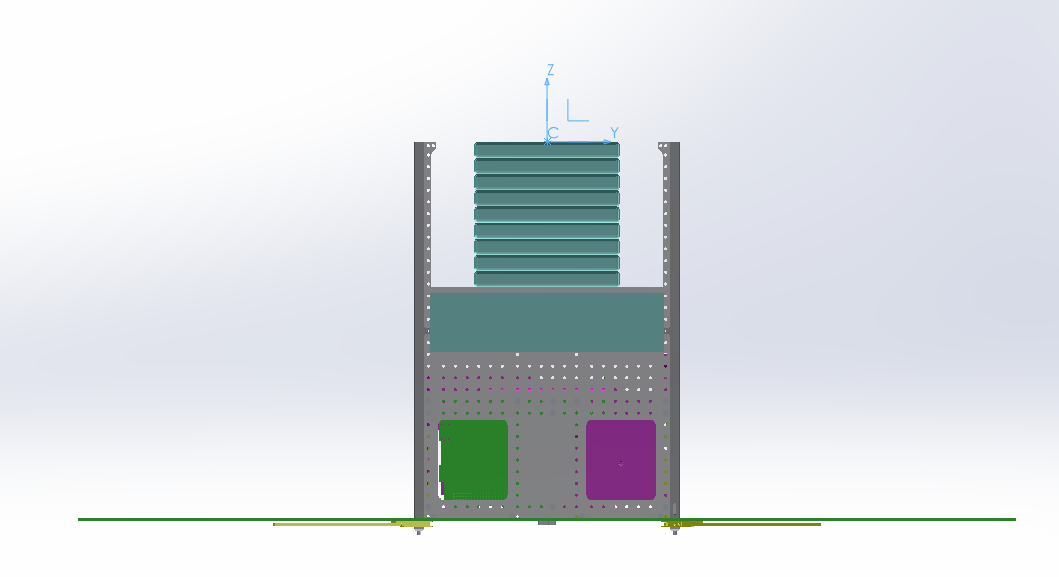
NovaSat - a LEO CubeSat for Gamma-Ray Detection
Nova-Sat is a cost-effective LEO mission that will localize and transmit GRB (Gamma-Ray Bursts) event data from the GALI detector to the astrophysics community and terrestrial telescopes.
Secondary missions are to produce near real-time GRB alerts and to serve as a space-based platform for research and education.
As part of the Structure and Deep Space Conditions Team, I was tasked with selecting the correct form factor for NovaSat, taking into consideration the nonstandard detector size and the operational constraints.
Upon choosing the CubeSat Platform, I had to arrange the components so that each element's weight was balanced and the center of mass was constrained to the center of the CubeSat.
During the upcoming semester, further work will be done to create a more robust internal layout and initial thermal and modal analyses.
The NovaSat Project is In Memory of Captain (res.) Denis Krokhmalov Veksler And The Victims of the ‘Nova’ Festival.
The Project in the press:
https://www.ynet.co.il/environment-science/article/rycs911gct
https://aerospace.technion.ac.il/news/23489/


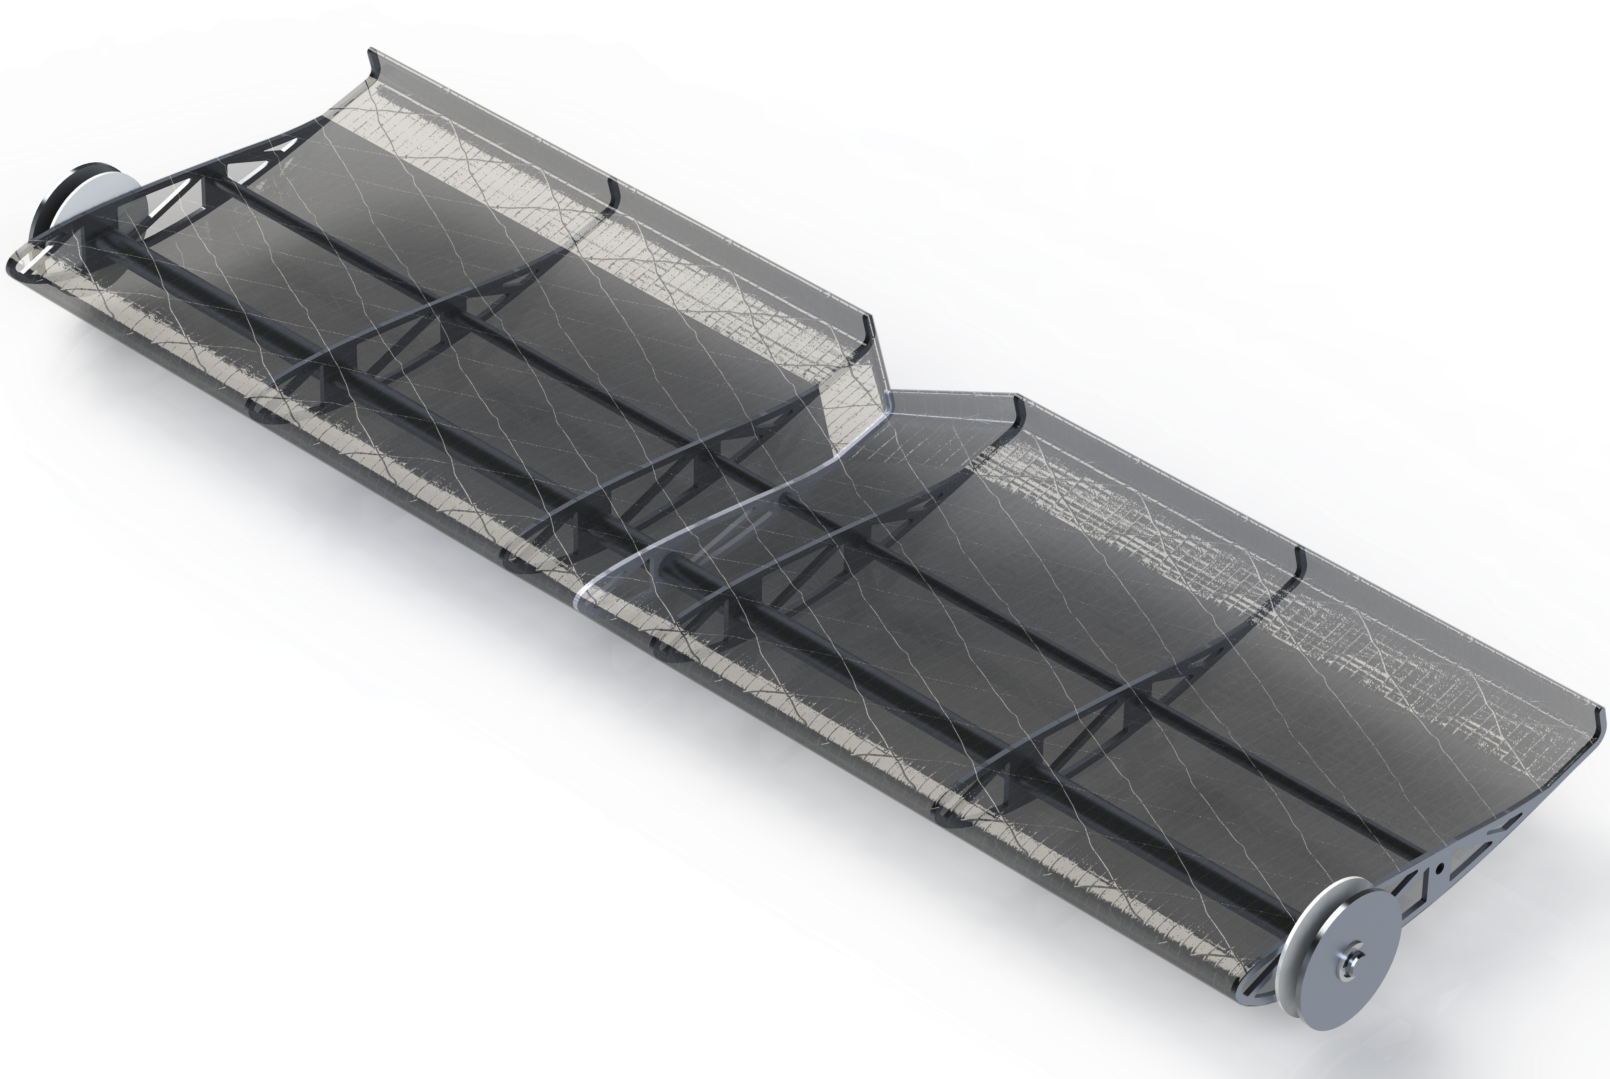
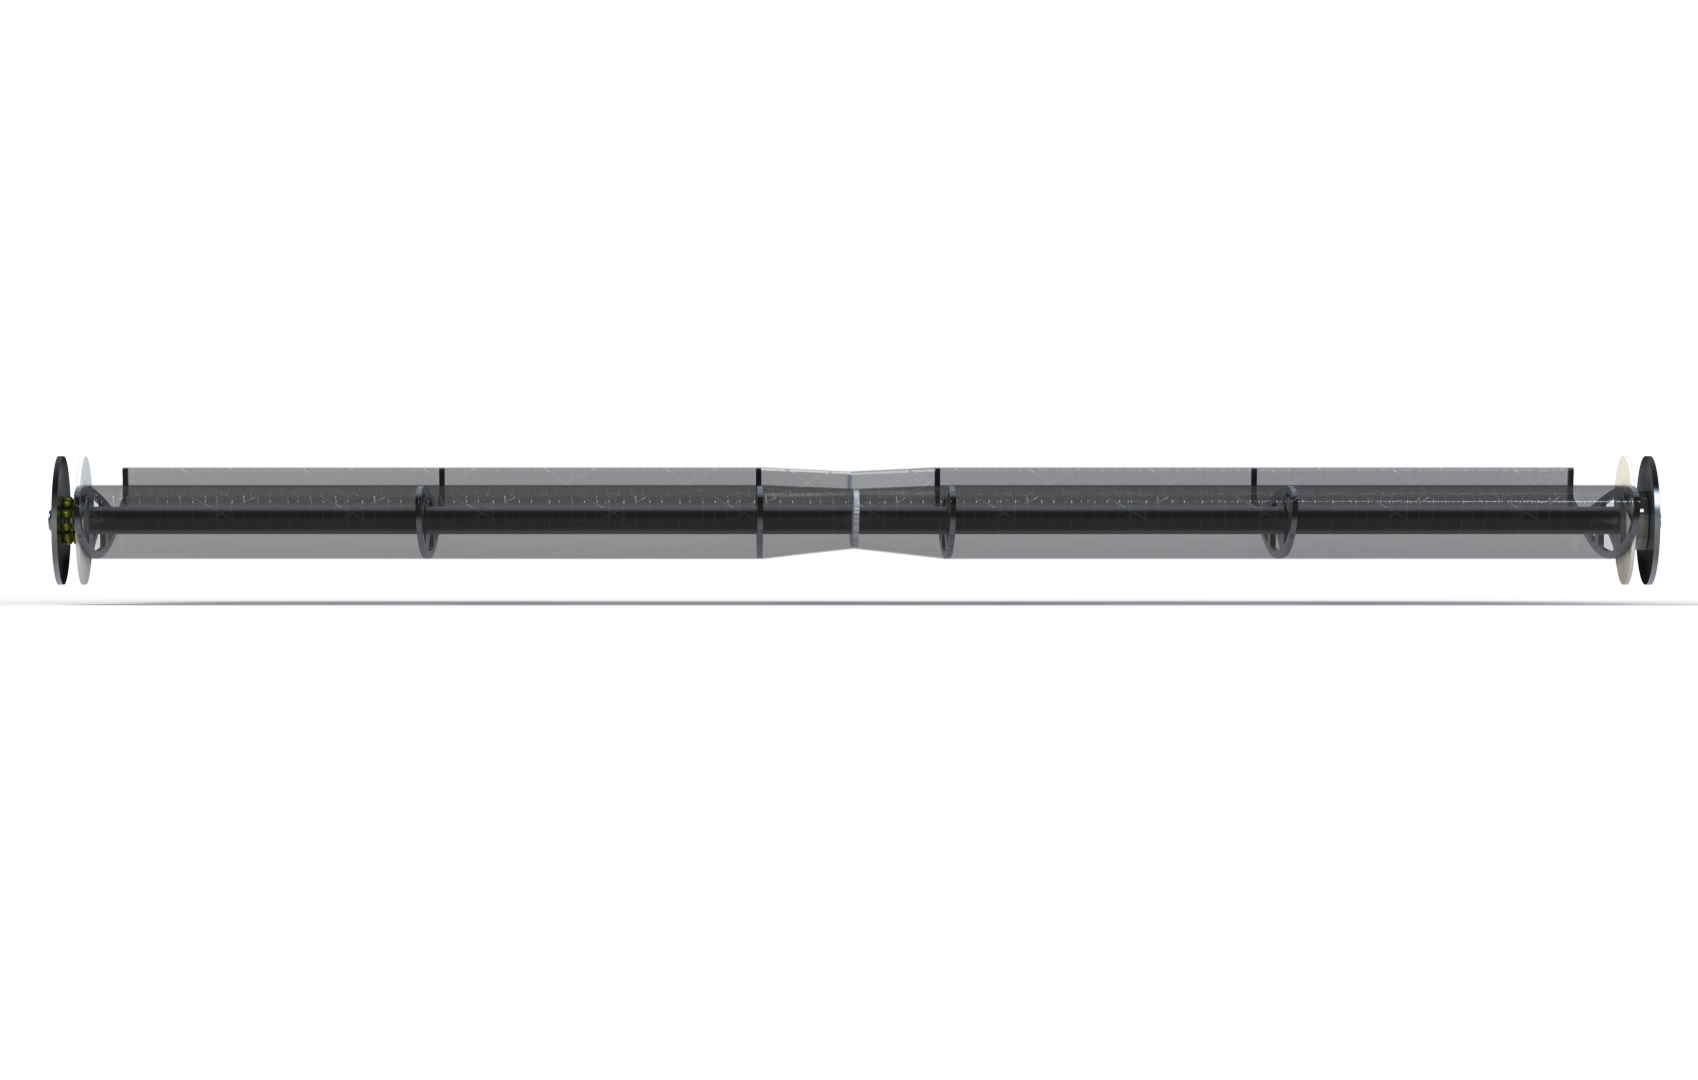
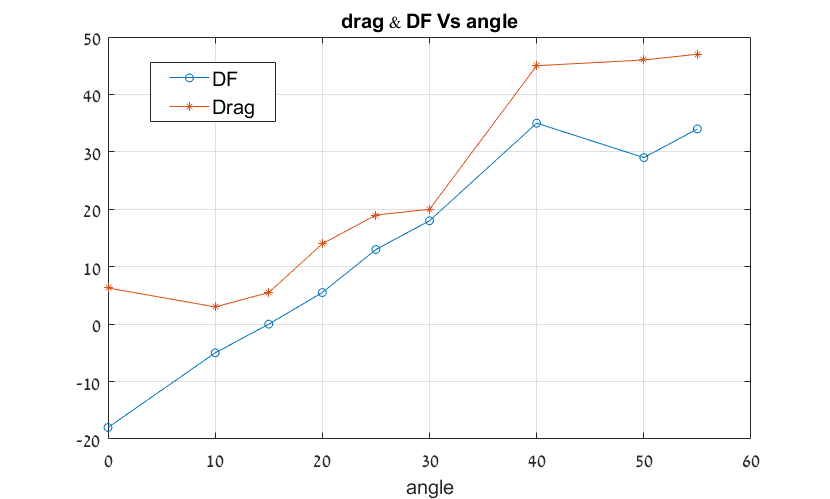
Formula Technion DRS Wing
The Formula Technion project is a long running project at my university.
I joined the team for the 2020-2021 Season and was a part of the aerodynamics team and was tasked with designing the DRS and Rear Wing elements with 3 more students.
We started working on the design and chose a multi element wing with S1223 as the main profile and Benzing Be 153-055 as the DRS wing profile.
After many iterations and CFD simulations to determine the best positions for the wings we chose the one that created the most down force and minimal drag.
Below, I added the many CFD and load simulations that we ran as well as detailed build pictures, graphs and tables we used.
Unfortunately, due to COVID-19 we were not able to build the car but our work helped the next generations of this project.


Faraday Cage
The Faraday Cage was a project that started in the CDL Lab. We had a high-frequency pulser that the experiential rig needed to be protected from.
The design requirements were as follows:
1. The cage must be able to fit the whole experiment rig into it
2. The cage needed to be all metal with solid connections between the plates
3. There needed to be meshed windows for optical access as well as a number of sensor and tube fittings while still protecting the rig
4. All the uncovered holes and clearances need to be under 5mm
5. There needs to be easy access to the front and top of the rig
In order to achieve the design requirements, I designed two hinged doors with mesh-covered windows as well as back bulkhead fittings for the sensors and tubes and a perforated bottom plate to match the breadboard the rig was mounted on.


Plasma assisted reforming for enhanced ammonia flames and reduced NOx emissions - a numerical study
This project is a Student research project under the Combustion and Diagnostics Lab at Technion University.
The objective of this project was to take the data from the Plasma reforming simulation code, run a Cantera flame simulation on the output and plot the data in a that we can derive conclusions from.
To achieve this goal, I used Python to intake the data, parse it and plot it using an Interactive Dashboard I wrote for this project.
The code for the project consists of 3 parts.
The logic behind the code is modularity. In order to achieve that I tried to separate the principal functions and use the device storage as much as possible.
The first segment of code uses the pandas library to read the output1.plt files and convert them to parquet files. The parquet files are smaller and contain the data parsed by pandas which makes them faster to read once converted.
In the second segment, we read the previously converted parquet files, read in only the specific time in the code that we want to (5ms for example) and remove all the excited species from the plasma simulation and run a Cantera flame simulation on it using the chemical kinetics model we chose.
The last part is the Interactive Dashboard Inside the dashboard you will see the graphs are interactive, you can click on the legend to show or hide specific molecules, you can zoom in on certain parts of the plot and you can use the camera icon to save an image of the plot as you see it now. The idea is to have a code-free option to create paper-ready graphs.
The tables house the data for each of the relevant simulations and pure NH3 case if selected.
The flame speed and flame temperature tables are sortable by the highest initial speed and highest peak temperature.)


